Financial Capital 14
All in all, a positive dynamics of financial and economic indices is observed due to expansion of production activity coverage as a result of formation of the NIAEP Moscow Branch. Consequently, we observe increase in proceeds from other services, growth in volume of design and survey work on new projects (Belarusian NPP, Nizhny Novgorod Project Contract), and conclusion of the contract for elaboration of detailed design documentation for the Baltic NPP.
In 2012 the proceeds of NIAEP amounted to
38,683.9 million rubles, which is 9.6% higher compared to the same index in 2011 (35,304.7 million rubles). In 2012 the net profit increased by 91.6% compared to the net profit in 2011 and amounted to 1,355.9 million rubles against 707.6 million rubles accordingly. The net profit margin increased from 2.0% in 2011 to 3.5% in 2012 (see Tables 7.1 and 7.2).
Table 7.1. Financial Results of NIAEP Activity 15

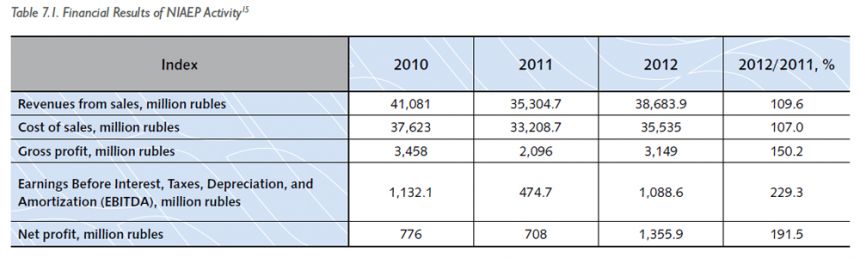
Table 7.2. Created and Divided Direct Economic Value, million rubles
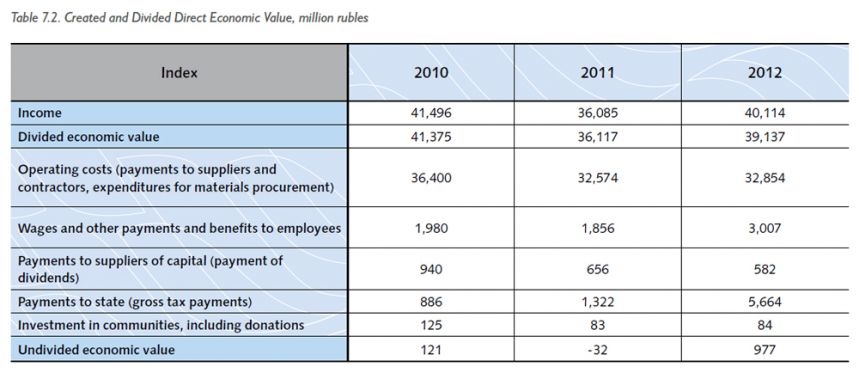
Fig. 7.1. Dynamic Structure of NIAEP Proceeds over 2010–2012
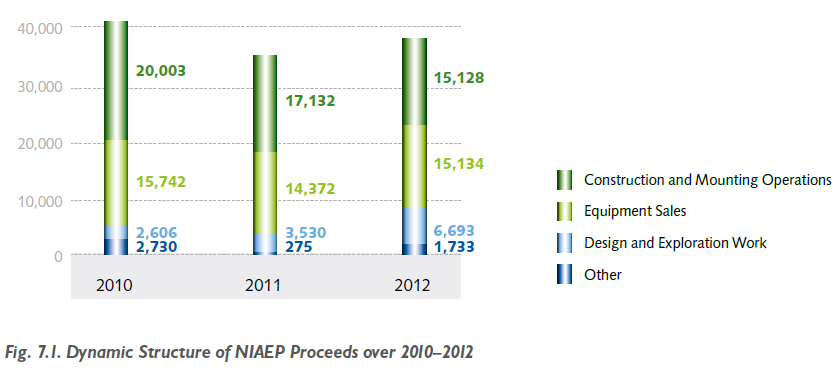
Compared to 2011, in 2012 increase in proceeds in the segments “Equipment Sales”, “Design and Exploration Work” and “Other” amounted to 5.3%, 89.6% and 530% accordingly. At the same time the proceeds in the “Construction and Mounting Operations” segment decreased by 11.7%.
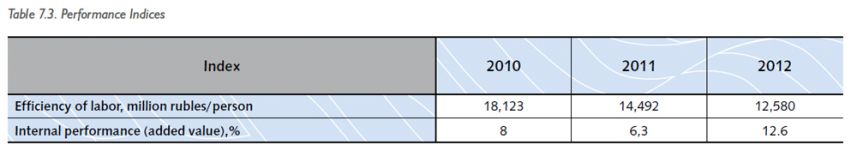
Table 7.3. Performance Indices
According to the 2012 results, the index of return on assets (ROA) amounted to 1.73%, which is almost twice as high as in 2011. The increase in this index is connected with increase in the net profit by 91.6% from 707.6 million rubles in 2011 to 1,355.9 million rubles, whereas the amount of assets of the Company remained almost unchanged: 78,727.1 million rubles in 2011 and 78,288.7 million rubles in 2012. At the same time, decrease in this index in 2011 to
0.9% compared to 1.97 in 2010 is conditioned by the drastic increase in the amount of the Company’s assets from 39.376,4 million rubles in 2010 to 78.727,1 million rubles in 2011, while the net profit has slightly decreased from 776.3 million rubles to 707.6 million rubles accordingly. A significant growth in assets is connected with advance financing received for current and new projects.
The 2010–2012 dynamics of the return on equity (ROE) index was conditioned by the net profit received in the reporting period and change in the Company’s equity capital. The equity in its turn was formed by the Company’s charted and surplus capital which remained unchanged in the analyzed period and the amount of net profit minus dividends paid (undivided profit). Thus, in 2010, when net profit amounted to 776.3 million rubles, and equity equaled to 2,811.8 million rubles, the ROE index value amounted to
27.61%. In 2011 reduction in index was insignificant due to a small growth in the Company’s equity to 2,863.4 million rubles, and net profit amounted to 707.6 million rubles. In 2012 due to significant growth in net profit to 1,355.9 million rubles with an increase in equity by 770.8 million rubles to 3,634.2 million rubles, the ratio reached the value of 37.31. It shall be also noted, that 2011 the dividends were paid for 2010 in the amount of 656.2 million rubles, and in 2012 dividends paid for 2011 equaled to 585.2 million rubles. Decision on payment of dividends in 2012 will be taken in 2013. Profit margin value is given in Table 7.4.
Table 7.4. Return Indices
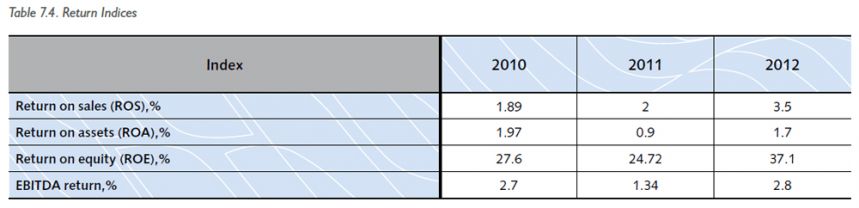
Table 7.5. Liquidity Indices
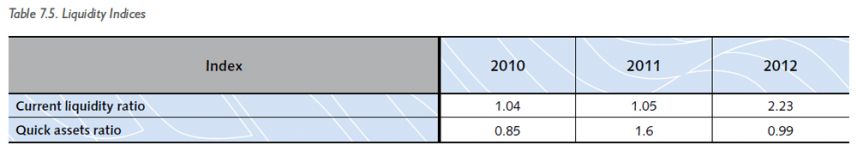
The growth in current liquidity ratio is connected with an insignificant change in the NIAEP balance structure, namely reduction in short-term liabilities of the Company by 5,457.5 million rubles as a result of return of recurring advances gained in the balance sheet line “Other Long-Term Liabilities” (+ 4,248.2 million rubles). At the same time, the amount of current assets of the Company has reduced by 1,433.3 million rubles only.
According to the results of 2012, the quick assets ratio reduced to 0.99 due to reduction in the line “Financial Investments” from 30,320 million rubles as of December 31, 2011 to 18,200 million rubles as of December 31, 2012. Funds in the amount of 12,120 million rubles were allocated for advance payments to counteragents, mainly long-term ones. Consequently, long-term receivable which is not taken into account during calculation of the quick assets ratio has increased by 12,034 million rubles in 2012, and current receivable has increased by 1,760 million rubles only, which led to reduction in ratio.
14 Information in Chapter 7.1 Financial Capital is given with regard to JSC NIAEP.
15 Indices are calculated in accordance with the data of the 2012 accounting records prepared for the purpose of generation of State Corporation ROSATOM consolidated statements. Deviations of indices taken from the accounting records submitted to tax, statistical and other public authorities are insignificant.